


In 30 years of obsessing over business operations—from my early days running healthy fast-food spots with Nude to overseeing thousands of staff across hospitals and stadiums with Aramark—I’ve seen bright, passionate operators make the exact same mistake over and over again.
They sit in their office on a Monday morning, pull up last week’s numbers, and stare at one number: Labour Cost Percentage.
They see 35%. They wanted 30%. They sigh, walk out to the floor, and tell their team, “We’ve got to cut costs this week.”
Here is the problem with that scenario: Labour cost percentage is an autopsy. It tells you what went wrong after the shift has ended, after the profit has leaked out the door, and after it’s far too late to do anything about it. You can’t go back to your team on Monday and say, “Guys, you need to work a week for free because we lost money last week.” That horse has bolted.
If you want to actually control your biggest, most volatile, and most perishable cost, you need to stop managing by historical percentages and start setting live operational targets. You need to track Sales Per Labour Hour (SPLH).
What is Sales Per Labour Hour (SPLH)?
To put it simply, Sales Per Labour Hour (SPLH) is a Key Performance Indicator (KPI) that measures how much gross revenue your business generates for every single hour of staff labour worked.
While labour cost percentage is a complex, lagging financial ratio tied up in variable wage rates, overtime calculations, and tax contributions, SPLH is a straightforward productivity metric. It answers one vital, real-time question:
“How much money are we bringing in right now for every hour someone is on the clock?”
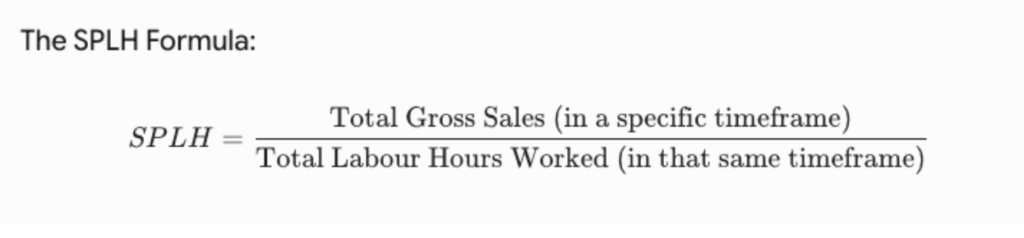
The SPLH Formula:
A Quick Example:
If your restaurant generates €1,000 in sales between 12:00 PM and 2:00 PM, and you have 5 staff members working that entire 2-hour window (a total of 10 labour hours), your SPLH for that lunch service is €100.
The "Target £30" Logic: Why SPLH Works on the Floor
Why do I love SPLH so much? Because floor managers can actually use it. If you tell a 24-year-old floor manager on a frantic Friday night to “keep labour at 28%”, that number means almost nothing to them in the heat of service. It’s an abstract finance term. They don’t know who’s on overtime, what the Sunday premium rates are, or how employer contributions factor into the hourly pay bill.
But if you give them a live metric, everything changes.
Let’s do the simple math we used to run back at Nude. Say your average wage rate across your shift is €7.50 an hour, and your operational target is a 25% labour cost.

Suddenly, you aren’t asking your manager to do higher-level accountancy during dinner prep. You’ve given them a game to play: “We need €30 in sales for every hour worked today.”
It’s simple. It’s tangible. And best of all, it happens live.
The Operational Advantage: Leading vs. Lagging Indicators
In business management, there are two types of metrics: Lagging (which tell you what happened) and Leading (which help you predict what will happen).
|
Lagging Metric (The Autopsy)
|
Leading Metric (The Steering Wheel)
|
|---|---|
|
Labour Cost Percentage
|
Sales Per Labour Hour (SPLH)
|
|
Calculated days/weeks after the shift
|
Calculated hourly during the shift
|
|
Obscured by mixed pay rates, overtime, & tax
|
Pure ratio of sales generated to hours consumed
|
|
Forces reactive, panicky decision-making
|
Enables proactive, "in-flight" operational tweaks
|
When you manage by SPLH, your floor managers check the live numbers at 1:00 PM, 3:00 PM, and 5:00 PM.
If it’s 3:00 PM on a Tuesday, sales are dead due to unexpected rain, and your SPLH has dropped from your target of €30 down to €14, your manager knows right then that they are drastically overstaffed. They don’t have to wait for Monday’s profit-and-loss statement to realize they lost money. They can make an “in-flight” decision: send a kitchen porter home early, cross-train a waiter to cover the bar, or start prep work early for the dinner rush, to potentially save the day
Conversely, if your SPLH is sitting at €90, your team might be getting crushed, service speed is likely dropping, and guests are waiting too long for drinks. An abnormally high SPLH is an early warning indicator that service quality is about to suffer, giving you time to call in extra cover before bad reviews land on Google or Tripadvisor
How to Roll Out SPLH in Your Operation (Without Micromanaging)
Setting KPIs is one thing; getting a floor team to care about them is another. Here is how we operationalised SPLH across our businesses:
1. Integrate Your POS with Your Scheduling Platform
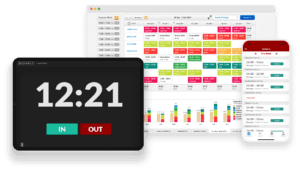
You cannot calculate SPLH on the back of a napkin during service. Modern workforce management platforms like Bizimply connect directly with your Point of Sale (POS) system. By matching live, down-to-the-minute sales data against real-time clock-ins from the floor, managers get a live SPLH feed straight to their dashboard.
2. Share the Numbers with the Whole Team
KPIs shouldn’t be a secret kept in the manager’s office. Everyone—from the head chef to the dishwashers—should know the target SPLH.
We used to hold 5-minute “pre-service briefs” before every shift. We’d write the day’s numbers on a big whiteboard in the kitchen: reserved covers, weather forecast, daily specials, and our Target SPLH. When the team understands that hitting that SPLH number is what keeps the doors open, protects their jobs, and funds performance bonuses, they stop viewing scheduling decisions as arbitrary cuts and start viewing them as team goals.
3. Use the “Box of Tomatoes” Visualization
If team members struggle with the concept of labour metrics, visualize it. I used to grab a box of 100 tomatoes in the kitchen and pull them out one by one in front of the staff:
- “35 of these tomatoes go straight to paying our wages.”
- “25 go to buy the raw food ingredients.”
- “15 go to pay the landlord’s rent.”
- “15 go to taxes, electricity, and keeping the lights on.”
- “That leaves us with just 5, or maybe 10 tomatoes.”
When staff visually see how thin that margin is, they instantly understand why tracking hours and hitting that €30-an-hour SPLH target matters so much.
Frequently Asked Questions
What is a good Sales Per Labour Hour (SPLH) target for a restaurant?
A healthy SPLH varies based on your business model, service style, and geographical location. However, in the UK and European hospitality markets, a standard baseline target typically ranges between £30 and £60 (€35 to €70) per labour hour. High-volume QSRs (Quick Service Restaurants) or coffee shops may aim much higher, while fine-dining establishments with heavy prep requirements may operate on lower SPLH targets compensated by higher average check sizes.
How do you calculate required SPLH from a target labour percentage?
To find your required SPLH, divide your business’s average weighted hourly wage rate by your target labour percentage decimal.

Example: If your average pay rate across all staff is £10.50/hr and your target labour cost is 30% (0.30)
£10.5/.3 = £35
Can you improve SPLH without cutting staff hours?
Yes. SPLH is a ratio of productivity, not just cost reduction. You can improve your SPLH by increasing top-line sales without adding hours—for example, by upselling high-margin items, engineering a faster menu mix, or cross-training front-of-house staff to eliminate bottleneck delays during peak trading windows.
In an industry running on 5% profit margins, you cannot afford to manage your business through a rear-view mirror. Stop treating labour like a fixed weekly expense, start tracking Sales Per Labour Hour in real time, and empower your managers to protect your bottom line hour by hour, shift by shift.
How Bizimply Bridges the Gap
This is precisely why we built Bizimply, to give operators the steering wheel, not just the autopsy. Bizimply connects directly with your Point of Sale (POS) system, pairing real-time sales data with live clock-ins to show your exact Sales Per Labour Hour (SPLH) as service unfolds. Instead of wrestling with complex spreadsheets or calculating margins after the shift is over, your floor managers get an instant, actionable view of team productivity right on their dashboard. Whether it’s signaling an unexpected slowdown or warning you before service quality dips during a rush, Bizimply transforms labour management from a stressful weekly accounting chore into an easy, proactive game your whole team can play.